
Report your corporate footprint and track targets, from real products.
A bottom-up inventory built from the products you actually made, not spend factors. Fix a baseline, set a target, see whether you are on track, and know what you could file today.
Company · 2025 actuals vs 2023 baseline
41,280 t CO₂e
Scope 1, 2 and product-relevant Scope 3 · 353 SKUs
From a volume file to a number a board can sign.
- 01
Upload production volumes, and revenue if you have it
A CSV from your ERP, matched to your modelled SKUs. Resolved, unresolved and omitted rows are shown; date overlaps are blocked so nothing is double counted.
- 02
Fix a baseline and roll it up
A fixed-year baseline in PEF and GHG terms, per workspace and across every workspace to one company view. Facility- and supplier-level attribution in tonnes CO₂e.
- 03
Set targets and watch the trajectory
Per-category or overall targets, year-over-year or long-term. Historical reports show actuals; forecast reports project planned volumes; progress tracking says on track or insufficient.
- 04
Read what you could file
Five disclosure-readiness chips, earned from your data or marked not assessed: PEF, CSRD ESRS E1, SBTi, GHG scopes, TCFD. Never assumed.


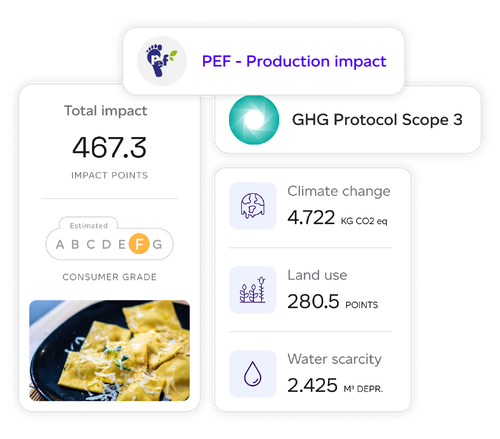
An inventory that traces to ingredients, not to invoices.
- Baseline, historical and forecast reports
Portfolio footprint for a base year, a date range of actuals, or a production plan, in a PEF or GHG lens, with CSV export.
- Scope 1, 2 and 3 inventory
Named Scope 3 categories where product data supports them, per-gas totals, biogenic and avoided emissions.
- Targets and progress
Year-over-year or long-term targets with on-track status against baseline and forecast.
- Company scope
One canonical view across every workspace, for the group sustainability lead and the CFO.
- Disclosure readiness
PEF, CSRD E1 and SBTi readings earned from a baseline of adequate data quality and a target on record.
- FLAG land-sector split in the GHG lensComing soon
Land-sector emissions reported separately from energy and industry, as the SBTi FLAG guidance asks.
“By integrating environmental impact insights into product design, simple changes have been identified: in one example, switching the sourcing of an ingredient would reduce its impact on water scarcity by 33%.”

The package for this
Footprinting, then Action & Mitigation
Volumes, baseline, historical and forecast footprints and company scope are in Footprinting. Targets, progress tracking and the AI reduction agent arrive with Action & Mitigation, through our team.
From
£1,060
per year · Footprinting · Action & Mitigation priced for your range