Every food product has a category, chosen in its product details (see How can I create a food product manually?). It sets the default food loss and waste rates and the typical production steps, and it groups the product wherever you read your portfolio. Categories sit in groups: "Bread" is in "Grain & bakery", for example. If your account has its own category list, its categories are used instead, without groups.
The Home dashboard and Analytics views below need the plans that include them.
In the Sold products list
- A Category column follows Type. It shows the product's category, with its group when you hover over it. A food product with none reads Uncategorised, greyed out; packaging products and recipes show a dash. Search results show the column too.
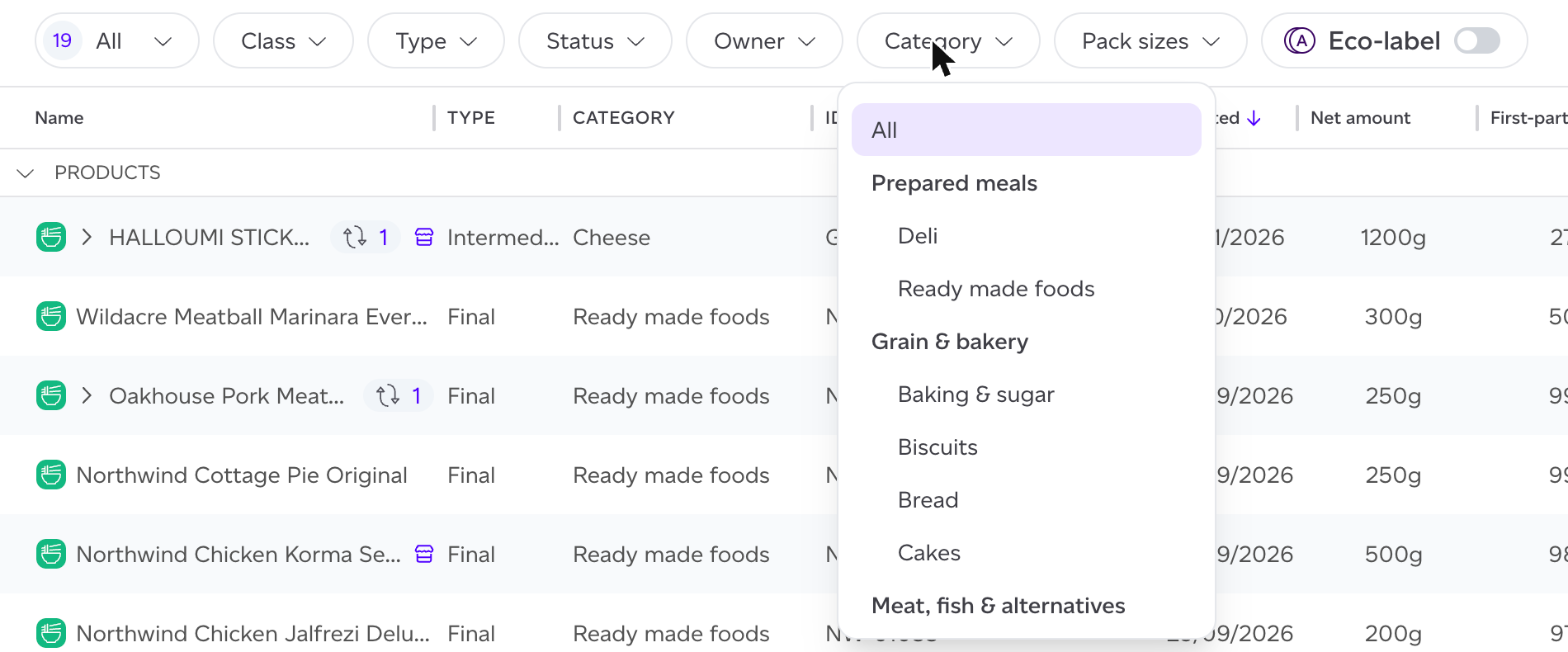
- The Category filter, beside Owner, narrows the list to a category. It lists each group in bold followed by its categories: pick a group to see all of its categories at once. Only categories your food products are on are offered, and Uncategorised finds the products that have none.
On a product report
On a food product, the report header names its category, for example Ready made foods, with its group when you hover over it. It is on the PEF overview, the Production tile, the GHG header and the Risk overview. The product details, opened from the icon beside the product name, give both: "Category: Ready made foods · Prepared meals".
On volume reports
Baselines, historical reports and volume forecasts read your products by category:
- The Production Volumes table has a Category column.
- Products CSV adds Category and Category group.
- Every tab (PEF, GHG, Risk and Data quality) has a By product category card: the groups, each opening onto its categories, with each one's share of the figure and share of volume (in units where the report weighs units).
Categories are read when a report is shown, not stored with it, so a baseline set before you categorised your products shows today's categories.
In exports
The CSV from Download impact data as CSV in Sold products ends with each product's `category` and `category_group`. See How do I export impact data for many products?
On the Home dashboard
- Largest contributors has a Products / Categories switch. Each category row opens the product list filtered to it.
- Product entries says how many sold food products have no category yet, for example "4 products have no category", with a link to them.
In Analytics
- ESG, for the workspace and for the company, shows the footprint by product category.
- Risk shows the mean risk score of each product category.
When nothing is categorised
Where none of the products in view has a category, each of these cards says "None of these products has a category yet. Give them one to see the footprint by category." Categorise products opens the product list so you can set them.