A footprint says what your portfolio does to the environment. Climate & Nature risk looks the other way: what the environment could do to your portfolio, through the physical hazards facing the places your ingredients come from. It is one of the lenses on the dashboard.
Headline scores use today's climate, based on recent historical records. The Climate scenarios block shows the same products under SSP5-8.5 in 2050, the IPCC high-emissions scenario, as a conservative view of a world that does not decarbonise. The 2050 view sits alongside the headline rather than replacing it.
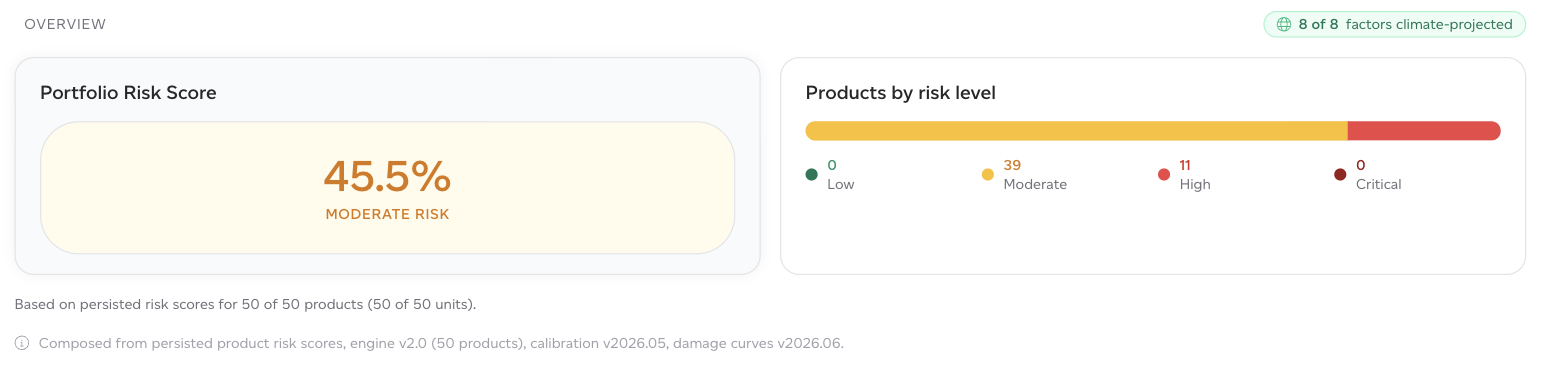
The portfolio risk score
A single percentage with a band: low, moderate, high or critical. It is the average of your per-product risk scores, and on the live dashboard each product counts equally, because products carry no production volumes outside reports. Where volumes are known (baselines, historicals, forecasts and the company risk lens), each product is weighted by its volume instead, so a hazard facing a product you sell in quantity counts for more than the same hazard on one you barely ship.
It is an average rather than a sum, so a larger portfolio does not look riskier simply because it holds more products.
The panel says how many products it covers. A product with no risk score is excluded rather than counted as zero, and the count is how you tell the difference.
Products by risk level
The distribution behind the headline: how many products sit in each band. A moderate portfolio average with eleven products in the high band is a different situation from one with none, and the average alone will not tell you.
Hazards
The score covers eight hazards: flood, drought, frost, wildfire and smoke, water stress, tropical cyclone, heat and soil degradation. Each is scored where your ingredients are actually sourced, which is why sourcing country matters to this number.
The largest single hazard is called out by name, because the response to frost exposure is not the response to water stress.
Nature readings
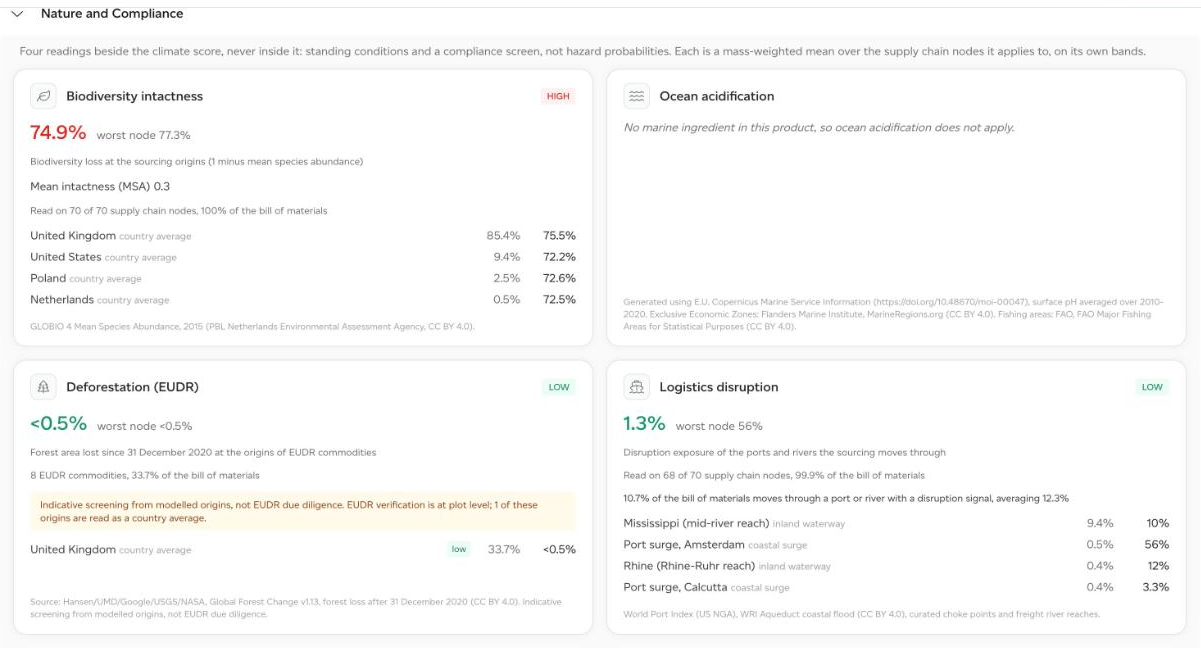
Beside the eight hazards sit four nature readings. They are reported on their own, each on its own bands, and never folded into the climate score: they describe standing conditions and a compliance screen, not the chance of an event.
- Biodiversity intactness: biodiversity loss at your sourcing origins (1 minus mean species abundance).
- Ocean acidification: acidification stress at the origins of your marine ingredients. A product with no marine ingredient shows that it does not apply.
- Deforestation (EUDR): forest area lost since 31 December 2020 at the origins of the seven EUDR commodities.
- Logistics disruption: disruption exposure of the ports and rivers your sourcing moves through, with the share of the bill of materials that moves through an exposed one.
Each reading is a mass-weighted mean over the supply chain nodes it applies to, and names its worst node and how much of the product it covers. They describe today's conditions, not 2050, and most origins are read as a country or sea-area average.
The deforestation reading is an indicative screen from the origins modelled on each ingredient, not EUDR due diligence, which is verified at plot level. The card says so.
On a product, open the report and choose Risk in the lens menu at the top: the readings are in the Nature and Compliance section, below the hazards.
On a change model, the risk lens shows the four readings for the original and the modelled product side by side, so you can see whether a reformulation moves you onto or off a more exposed origin.
The ESRS view
The Disclosure view (ESRS E1 to E4) maps every risk axis to its ESRS topic: nine climate axes from the hazards, and three nature axes from the readings (ocean acidification under E3, deforestation and biodiversity intactness under E4). Each row says how many products it covers. A row reads Not yet assessed only for products last scored before the nature readings existed, and recalculating them fills it in. That is not the same as a low score.
Trend against baseline
The trend compares your frozen baseline snapshot against the same products at their latest risk scores, so what you are reading is genuine movement rather than the effect of adding products since.
Hazards scored on only one side show as no movement rather than a movement from zero. A hazard that was not scored at baseline has not gone from nothing to something, it has gone from unknown to known, and showing that as a jump would be wrong.
Where risk comes from
Risk scores are stored when a product is saved or recalculated, and read from those stored results rather than computed while you wait. A product without a score is a coverage gap, not a safe product: it has not been scored yet, most often because it has not been saved or recalculated since the risk lens was switched on.
The commodity view in particular needs a recalculation to populate, so if it looks emptier than the rest, that is why.
The full method
The Methodology page in the app has a Climate & Nature risk tab that sets out the full method: what each hazard measures and where its data comes from, how scores are combined, and the limitations to keep in mind.