A procurement lead and an ESG reporting lead are looking at the same portfolio and asking completely different questions of it. The Analytics section gives each of them a dashboard built around their question rather than one dashboard everyone has to interpret.
The four views
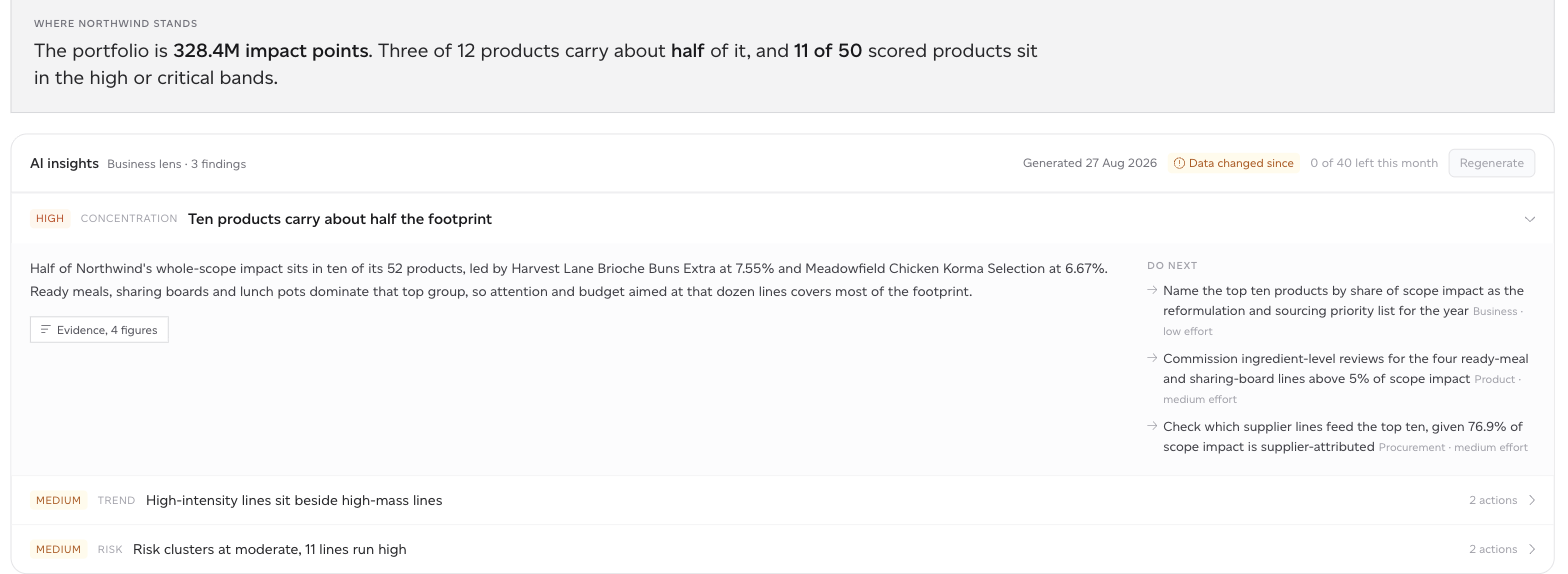
- Business: the commercial picture. Portfolio footprint, risk position, and the products carrying the most impact. For anyone who needs the headline and where it comes from.
- ESG: the reporting picture. Structured for disclosure and for tracking against commitments.
- Product: the development picture. Where impact sits within products, and what a formulation change would move.
- Procurement: the supply picture. Suppliers, sourcing countries and the exposure that comes with them.
They read the same underlying figures. What differs is what is put first and what is left out.
Each card also carries a one-line reading of its own number, so the figure arrives with its interpretation rather than needing one.
AI insights
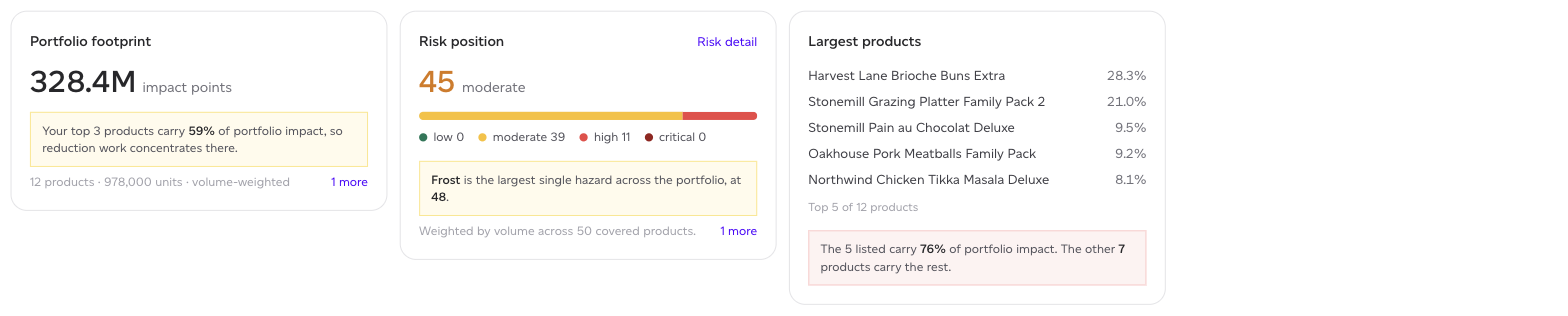
Above the cards, AI insights is a set of findings generated against your actual portfolio rather than a template. Each finding carries:
- a severity (high or medium) and a category such as concentration, trend or risk;
- a headline and a short explanation citing your own products and figures;
- Evidence, the figures the finding was drawn from, so you can check it rather than take it on trust;
- Do next, concrete actions, each labelled with the role that would own it and roughly what it would take.
The panel header shows when the set was generated, how much of your monthly allowance is left, and a 'Data changed since' warning when your portfolio has moved since the insights were written. That warning matters: an insight is a snapshot, and stale figures in a confident sentence are worse than no sentence.
Regenerate produces a fresh set and counts against the monthly allowance, since each run is a real model call. Existing findings stay in place when the allowance is used up, so the dashboard still reads.
Insights summarise and suggest. They do not decide, and they know nothing about your cost, contracts or product roadmap. Read them as a fast orientation, then look at the numbers underneath.
Workspace and company scope
The 'This workspace / Whole company' toggle at the top decides the scope. By default a dashboard covers the workspace you are in. Where your organisation runs several workspaces, whole-company scope rolls them into one figure, so "what is our footprint" has a single answer rather than one per workspace.
Company scope is a separate part of the plan, and access can be restricted by role, because a company-wide rollup crosses boundaries that workspace permissions otherwise keep.
'How these figures are worked out' explains the basis of what you are reading, which is worth opening once: the workspace and company figures are built differently, and so are the weighted and unweighted shares.